
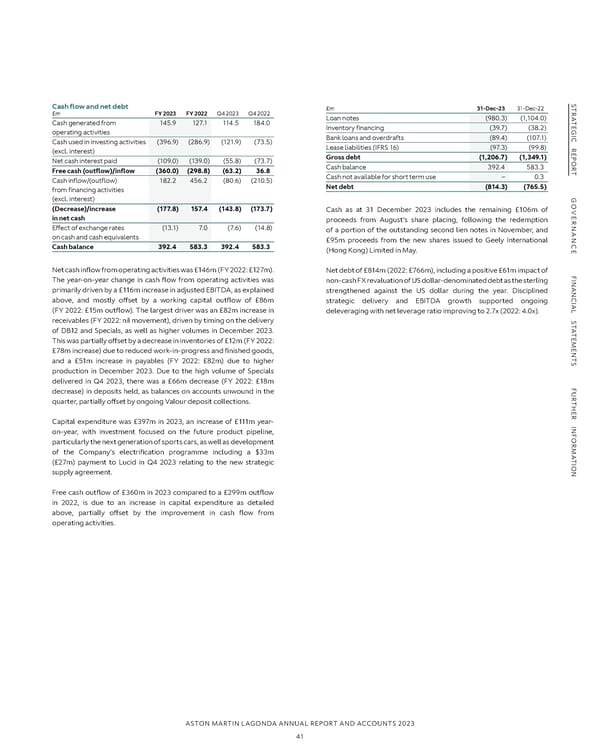
S S TR Cash flow and net debt £m 31-Dec-23 31-Dec-22 TR £m FY 2023 FY 2022 Q4 2023 Q4 2022 A Loan notes (980.3) (1,104.0) A TE Cash generated from 145.9 127.1 114.5 184.0 TE G Inventory financing (39.7) (38.2) G I operating activities I C Bank loans and overdrafts (89.4) (107.1) C R Cash used in investing activities (396.9) (286.9) (121.9) (73.5) R Lease liabilities (IFRS 16) (97.3) (99.8) E (excl. interest) E P Gross debt (1,206.7) (1,349.1) P O Net cash interest paid (109.0) (139.0) (55.8) (73.7) O R Cash balance 392.4 583.3 R T Free cash (outflow)/inflow (360.0) (298.8) (63.2) 36.8 Cash not available for short term use – 0.3 T Cash inflow/(outflow) 182.2 456.2 (80.6) (210.5) Net debt (814.3) (765.5) from financing activities G (excl. interest) G O O VE (Decrease)/increase (177.8) 157.4 (143.8) (173.7) Cash as at 31 December 2023 includes the remaining £106m of VE R in net cash proceeds from August’s share placing, following the redemption R NAN Effect of exchange rates (13.1) 7.0 (7.6) (14.8) of a portion of the outstanding second lien notes in November, and NAN on cash and cash equivalents £95m proceeds from the new shares issued to Geely International C Cash balance 392.4 583.3 392.4 583.3 C E (Hong Kong) Limited in May. E Net cash inflow from operating activities was £146m (FY 2022: £127m). Net debt of £814m (2022: £766m), including a positive £61m impact of F F I I NAN The year-on-year change in cash flow from operating activities was non-cash FX revaluation of US dollar-denominated debt as the sterling NAN primarily driven by a £116m increase in adjusted EBITDA, as explained strengthened against the US dollar during the year. Disciplined C above, and mostly offset by a working capital outflow of £86m C IAL strategic delivery and EBITDA growth supported ongoing IAL (FY 2022: £15m outflow). The largest driver was an £82m increase in S deleveraging with net leverage ratio improving to 2.7x (2022: 4.0x). S receivables (FY 2022: nil movement), driven by timing on the delivery T T A of DB12 and Specials, as well as higher volumes in December 2023. A T T E E M This was partially offset by a decrease in inventories of £12m (FY 2022: M E E N £78m increase) due to reduced work-in-progress and finished goods, N T T S and a £51m increase in payables (FY 2022: £82m) due to higher S production in December 2023. Due to the high volume of Specials delivered in Q4 2023, there was a £66m decrease (FY 2022: £18m F F U decrease) in deposits held, as balances on accounts unwound in the U R R T quarter, partially offset by ongoing Valour deposit collections. T H H E E R R INF Capital expenditure was £397m in 2023, an increase of £111m year- INF on-year, with investment focused on the future product pipeline, OR particularly the next generation of sports cars, as well as development OR M of the Company’s electrification programme including a $33m M A A T T I (£27m) payment to Lucid in Q4 2023 relating to the new strategic I ON ON supply agreement. Free cash outflow of £360m in 2023 compared to a £299m outflow in 2022, is due to an increase in capital expenditure as detailed above, partially offset by the improvement in cash flow from operating activities. ASTON MARTIN LAGONDA ANNUAL REPORT AND ACCOUNTS 2023 41
 Annual Report and Accounts Page 42 Page 44