
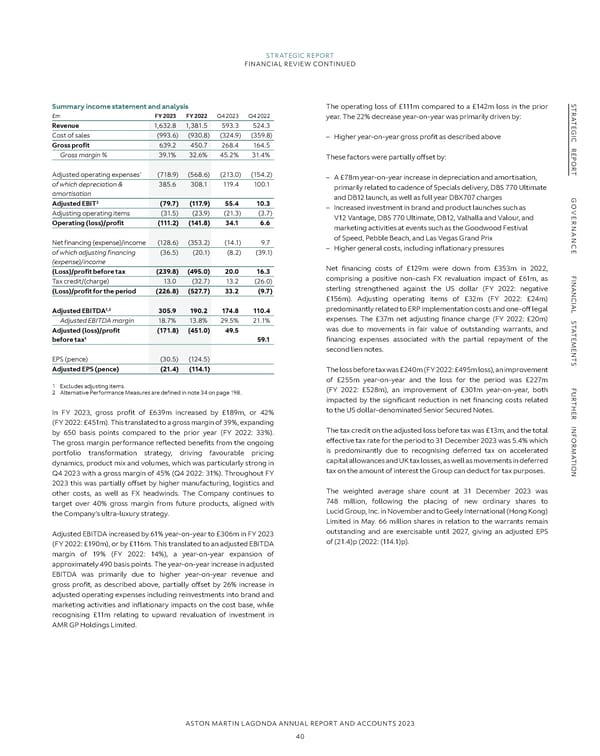
STRATEGIC REPORT FINANCIAL REVIEW CONTINUED S Summary income statement and analysis The operating loss of £111m compared to a £142m loss in the prior TR £m FY 2023 FY 2022 Q4 2023 Q4 2022 year. The 22% decrease year-on-year was primarily driven by: A Revenue 1,632.8 1,381.5 593.3 524.3 TE G Cost of sales (993.6) (930.8) (324.9) (359.8) I – Higher year-on-year gross profit as described above C Gross profit 639.2 450.7 268.4 164.5 R E Gross margin % 39.1% 32.6% 45.2% 31.4% These factors were partially offset by: P O R 1 (718.9) (568.6) (213.0) (154.2) T Adjusted operating expenses – A £78m year-on-year increase in depreciation and amortisation, of which depreciation & 385.6 308.1 119.4 100.1 primarily related to cadence of Specials delivery, DBS 770 Ultimate amortisation 2 and DB12 launch, as well as full year DBX707 charges G Adjusted EBIT (79.7) (117.9) 55.4 10.3 – Increased investment in brand and product launches such as O Adjusting operating items (31.5) (23.9) (21.3) (3.7) VE Operating (loss)/profit (111.2) (141.8) 34.1 6.6 V12 Vantage, DBS 770 Ultimate, DB12, Valhalla and Valour, and R marketing activities at events such as the Goodwood Festival NAN of Speed, Pebble Beach, and Las Vegas Grand Prix Net financing (expense)/income (128.6) (353.2) (14.1) 9.7 C of which adjusting financing (36.5) (20.1) (8.2) (39.1) – Higher general costs, including inflationary pressures E (expense)/income (Loss)/profit before tax (239.8) (495.0) 20.0 16.3 Net financing costs of £129m were down from £353m in 2022, F comprising a positive non-cash FX revaluation impact of £61m, as I Tax credit/(charge) 13.0 (32.7) 13.2 (26.0) sterling strengthened against the US dollar (FY 2022: negative NAN (Loss)/profit for the period (226.8) (527.7) 33.2 (9.7) £156m). Adjusting operating items of £32m (FY 2022: £24m) C 1,2 IAL Adjusted EBITDA 305.9 190.2 174.8 110.4 predominantly related to ERP implementation costs and one-off legal S Adjusted EBITDA margin 18.7% 13.8% 29.5% 21.1% expenses. The £37m net adjusting finance charge (FY 2022: £20m) T Adjusted (loss)/profit (171.8) (451.0) 49.5 was due to movements in fair value of outstanding warrants, and A T before tax1 59.1 financing expenses associated with the partial repayment of the E M second lien notes. E N EPS (pence) (30.5) (124.5) T Adjusted EPS (pence) (21.4) (114.1) S The loss before tax was £240m (FY 2022: £495m loss), an improvement of £255m year-on-year and the loss for the period was £227m 1 Excludes adjusting items. F 2 Alternative Performance Measures are defined in note 34 on page 198. (FY 2022: £528m), an improvement of £301m year-on-year, both U R impacted by the significant reduction in net financing costs related T H In FY 2023, gross profit of £639m increased by £189m, or 42% to the US dollar-denominated Senior Secured Notes. E R (FY 2022: £451m). This translated to a gross margin of 39%, expanding INF by 650 basis points compared to the prior year (FY 2022: 33%). The tax credit on the adjusted loss before tax was £13m, and the total effective tax rate for the period to 31 December 2023 was 5.4% which OR The gross margin performance reflected benefits from the ongoing is predominantly due to recognising deferred tax on accelerated M portfolio transformation strategy, driving favourable pricing A capital allowances and UK tax losses, as well as movements in deferred T dynamics, product mix and volumes, which was particularly strong in I tax on the amount of interest the Group can deduct for tax purposes. ON Q4 2023 with a gross margin of 45% (Q4 2022: 31%). Throughout FY 2023 this was partially offset by higher manufacturing, logistics and The weighted average share count at 31 December 2023 was other costs, as well as FX headwinds. The Company continues to target over 40% gross margin from future products, aligned with 748 million, following the placing of new ordinary shares to the Company’s ultra-luxury strategy. Lucid Group, Inc. in November and to Geely International (Hong Kong) Limited in May. 66 million shares in relation to the warrants remain Adjusted EBITDA increased by 61% year-on-year to £306m in FY 2023 outstanding and are exercisable until 2027, giving an adjusted EPS of (21.4)p (2022: (114.1)p). (FY 2022: £190m), or by £116m. This translated to an adjusted EBITDA margin of 19% (FY 2022: 14%), a year-on-year expansion of approximately 490 basis points. The year-on-year increase in adjusted EBITDA was primarily due to higher year-on-year revenue and gross profit, as described above, partially offset by 26% increase in adjusted operating expenses including reinvestments into brand and marketing activities and inflationary impacts on the cost base, while recognising £11m relating to upward revaluation of investment in AMR GP Holdings Limited. ASTON MARTIN LAGONDA ANNUAL REPORT AND ACCOUNTS 2023 40
 Annual Report and Accounts Page 41 Page 43