
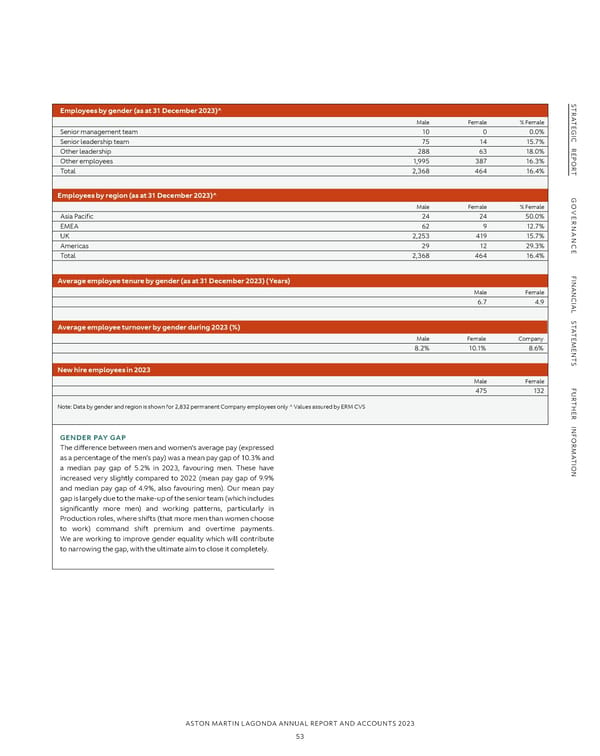
S S TR Employees by gender (as at 31 December 2023)^ TR A A TE Male Female % Female TE G Senior management team 10 0 0.0% G I I C C R Senior leadership team 75 14 15.7% R E Other leadership 288 63 18.0% E P P O Other employees 1,995 387 16.3% O R R T Total 2,368 464 16.4% T G Employees by region (as at 31 December 2023)^ G O Male Female % Female O VE Asia Pacific 24 24 50.0% VE R R NAN EMEA 62 9 12.7% NAN UK 2,253 419 15.7% C Americas 29 12 29.3% C E Total 2,368 464 16.4% E F F I I NAN Average employee tenure by gender (as at 31 December 2023) (Years) NAN Male Female C C IAL 6.7 4.9 IAL S S T T A Average employee turnover by gender during 2023 (%) A T T E Male Female Company E M M E 8.2% 10.1% 8.6% E N N T T S New hire employees in 2023 S Male Female F F U 475 132 U R R T T H Note: Data by gender and region is shown for 2,832 permanent Company employees only ^ Values assured by ERM CVS H E E R R INF INF OR GENDER PAY GAP OR M The difference between men and women’s average pay (expressed M A A T as a percentage of the men’s pay) was a mean pay gap of 10.3% and T I I ON a median pay gap of 5.2% in 2023, favouring men. These have ON increased very slightly compared to 2022 (mean pay gap of 9.9% and median pay gap of 4.9%, also favouring men). Our mean pay gap is largely due to the make-up of the senior team (which includes significantly more men) and working patterns, particularly in Production roles, where shifts (that more men than women choose to work) command shift premium and overtime payments. We are working to improve gender equality which will contribute to narrowing the gap, with the ultimate aim to close it completely. ASTON MARTIN LAGONDA ANNUAL REPORT AND ACCOUNTS 2023 53
 Annual Report and Accounts Page 54 Page 56