
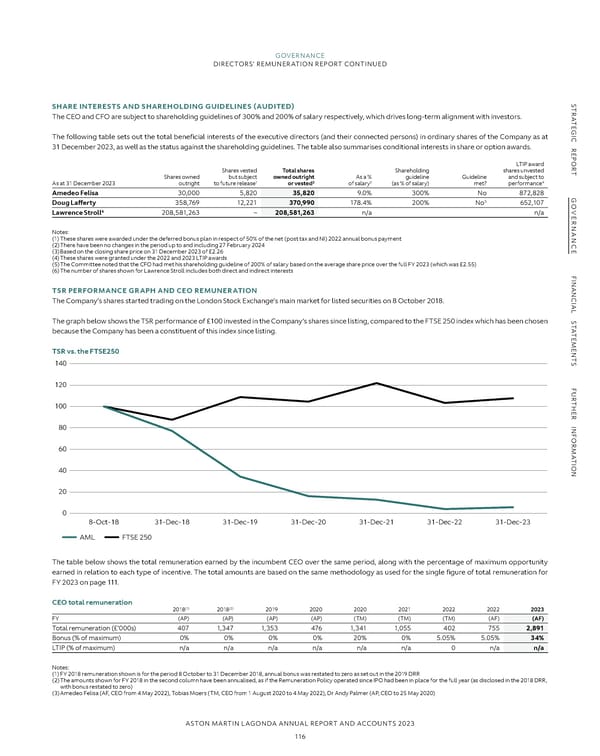
GOVERNANCE DIRECTORS’ REMUNERATION REPORT CONTINUED S SHARE INTERESTS AND SHAREHOLDING GUIDELINES (AUDITED) TR The CEO and CFO are subject to shareholding guidelines of 300% and 200% of salary respectively, which drives long-term alignment with investors. A TE G I The following table sets out the total beneficial interests of the executive directors (and their connected persons) in ordinary shares of the Company as at C 31 December 2023, as well as the status against the shareholding guidelines. The table also summarises conditional interests in share or option awards. R E P LTIP award O R Shares owned Shares vested Total shares Shareholding shares unvested T but subject owned outright As a % guideline Guideline and subject to 1 2 3 4 As at 31 December 2023 outright to future release or vested of salary (as % of salary) met? performance Amedeo Felisa 30,000 5,820 35,820 9.0% 300% No 872,828 5 G Doug Lafferty 358,769 12,221 370,990 178.4% 200% No 652,107 O Lawrence Stroll6 208,581,263 – 208,581,263 n/a n/a VE R Notes: NAN (1) These shares were awarded under the deferred bonus plan in respect of 50% of the net (post tax and NI) 2022 annual bonus payment (2) There have been no changes in the period up to and including 27 February 2024 C (3) Based on the closing share price on 31 December 2023 of £2.26 E (4) These shares were granted under the 2022 and 2023 LTIP awards (5) The Committee noted that the CFO had met his shareholding guideline of 200% of salary based on the average share price over the full FY 2023 (which was £2.55) (6) The number of shares shown for Lawrence Stroll includes both direct and indirect interests F I TSR PERFORMANCE GRAPH AND CEO REMUNERATION NAN C The Company’s shares started trading on the London Stock Exchange’s main market for listed securities on 8 October 2018. IAL The graph below shows the TSR performance of £100 invested in the Company’s shares since listing, compared to the FTSE 250 index which has been chosen S T A because the Company has been a constituent of this index since listing. T E M E TSR vs. the FTSE250 N T 140 S 120 F U R T 100 H E R 80 INF OR 60 M A T I 40 ON 20 0 8-Oct-18 31-Dec-18 31-Dec-19 31-Dec-20 31-Dec-21 31-Dec-22 31-Dec-23 AML FTSE 250 The table below shows the total remuneration earned by the incumbent CEO over the same period, along with the percentage of maximum opportunity earned in relation to each type of incentive. The total amounts are based on the same methodology as used for the single figure of total remuneration for FY 2023 on page 111. CEO total remuneration 2018(1) 2018(2) 2019 2020 2020 2021 2022 2022 2023 FY (AP) (AP) (AP) (AP) (TM) (TM) (TM) (AF) (AF) Total remuneration (£’000s) 407 1,347 1,353 476 1,341 1,055 402 755 2,891 Bonus (% of maximum) 0% 0% 0% 0% 20% 0% 5.05% 5.05% 34% LTIP (% of maximum) n/a n/a n/a n/a n/a n/a 0 n/a n/a Notes: (1) FY 2018 remuneration shown is for the period 8 October to 31 December 2018, annual bonus was restated to zero as set out in the 2019 DRR (2) The amounts shown for FY 2018 in the second column have been annualised, as if the Remuneration Policy operated since IPO had been in place for the full year (as disclosed in the 2018 DRR, with bonus restated to zero) (3) Amedeo Felisa (AF, CEO from 4 May 2022), Tobias Moers (TM, CEO from 1 August 2020 to 4 May 2022), Dr Andy Palmer (AP, CEO to 25 May 2020) ASTON MARTIN LAGONDA ANNUAL REPORT AND ACCOUNTS 2023 116
 Annual Report and Accounts Page 117 Page 119