
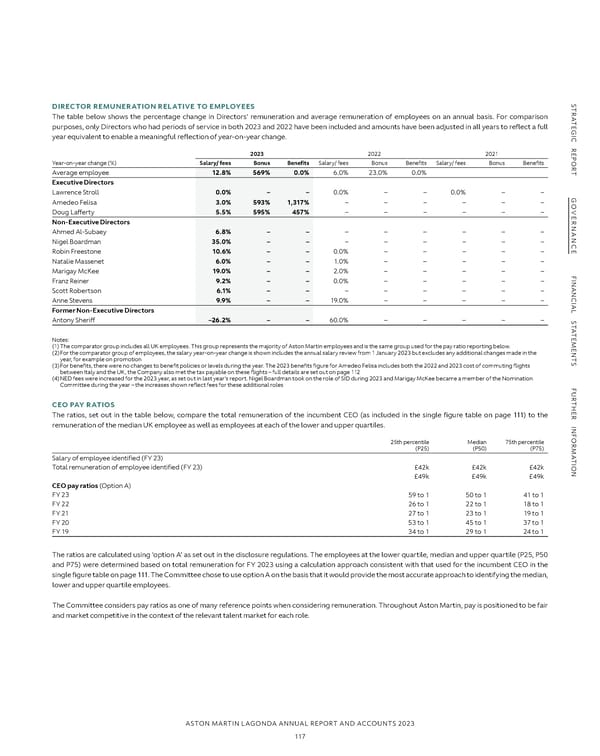
S S TR DIRECTOR REMUNERATION RELATIVE TO EMPLOYEES TR A The table below shows the percentage change in Directors’ remuneration and average remuneration of employees on an annual basis. For comparison A TE TE G purposes, only Directors who had periods of service in both 2023 and 2022 have been included and amounts have been adjusted in all years to reflect a full G I I C year equivalent to enable a meaningful reflection of year-on-year change. C R R E 2023 2022 2021 E P P O Year-on-year change (%) Salary/ fees Bonus Benefits Salary/ fees Bonus Benefits Salary/ fees Bonus Benefits O R R T Average employee 12.8% 569% 0.0% 6.0% 23.0% 0.0% T Executive Directors Lawrence Stroll 0.0% – – 0.0% – – 0.0% – – G G O Amedeo Felisa 3.0% 593% 1,317% – – – – – – O VE Doug Lafferty 5.5% 595% 457% – – – – – – VE R Non-Executive Directors R NAN Ahmed Al-Subaey 6.8% – – – – – – – – NAN C Nigel Boardman 35.0% – – – – – – – – C E Robin Freestone 10.6% – – 0.0% – – – – – E Natalie Massenet 6.0% – – 1.0% – – – – – Marigay McKee 19.0% – – 2.0% – – – – – F F I I NAN Franz Reiner 9.2% – – 0.0% – – – – – NAN Scott Robertson 6.1% – – – – – – – – C C IAL Anne Stevens 9.9% – – 19.0% – – – – – IAL S Former Non-Executive Directors S Antony Sheriff –26.2% – – 60.0% – – – – – T T A A T T E Notes: E M M E (1) The comparator group includes all UK employees. This group represents the majority of Aston Martin employees and is the same group used for the pay ratio reporting below. E N (2) For the comparator group of employees, the salary year-on-year change is shown includes the annual salary review from 1 January 2023 but excludes any additional changes made in the N T year, for example on promotion T S (3) For benefits, there were no changes to benefit policies or levels during the year. The 2023 benefits figure for Amedeo Felisa includes both the 2022 and 2023 cost of commuting flights S between Italy and the UK, the Company also met the tax payable on these flights – full details are set out on page 112 (4) NED fees were increased for the 2023 year, as set out in last year’s report. Nigel Boardman took on the role of SID during 2023 and Marigay McKee became a member of the Nomination F Committee during the year – the increases shown reflect fees for these additional roles F U U R R T T H CEO PAY RATIOS H E E R The ratios, set out in the table below, compare the total remuneration of the incumbent CEO (as included in the single figure table on page 111) to the R INF remuneration of the median UK employee as well as employees at each of the lower and upper quartiles. INF OR 25th percentile Median 75th percentile OR M (P25) (P50) (P75) M A A T Salary of employee identified (FY 23) T I I ON Total remuneration of employee identified (FY 23) £42k £42k £42k ON £49k £49k £49k CEO pay ratios (Option A) FY 23 59 to 1 50 to 1 41 to 1 FY 22 26 to 1 22 to 1 18 to 1 FY 21 27 to 1 23 to 1 19 to 1 FY 20 53 to 1 45 to 1 37 to 1 FY 19 34 to 1 29 to 1 24 to 1 The ratios are calculated using ‘option A’ as set out in the disclosure regulations. The employees at the lower quartile, median and upper quartile (P25, P50 and P75) were determined based on total remuneration for FY 2023 using a calculation approach consistent with that used for the incumbent CEO in the single figure table on page 111. The Committee chose to use option A on the basis that it would provide the most accurate approach to identifying the median, lower and upper quartile employees. The Committee considers pay ratios as one of many reference points when considering remuneration. Throughout Aston Martin, pay is positioned to be fair and market competitive in the context of the relevant talent market for each role. ASTON MARTIN LAGONDA ANNUAL REPORT AND ACCOUNTS 2023 117
 Annual Report and Accounts Page 118 Page 120