
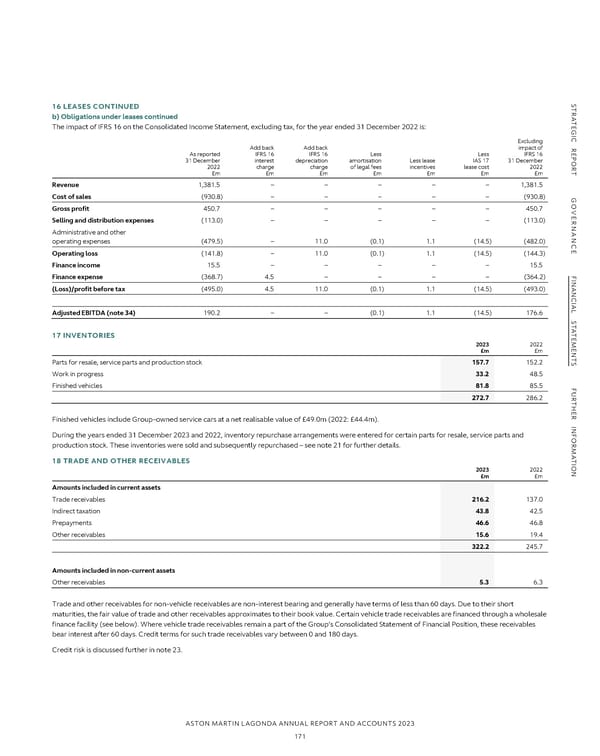
NOTES TO THE FINANCIAL STATEMENTS CONTINUED S S 16 LEASES CONTINUED TR 16 LEASES CONTINUED TR b) Obligations under leases Ab) Obligations under leases continued A The maturity profile of undiscounted lease cash flows accounted for under IFRS 16 is: TEThe impact of IFRS 16 on the Consolidated Income Statement, excluding tax, for the year ended 31 December 2022 is: TE G G I I C C 2023 2022 R Excluding R £m £m Add back Add back impact of E As reported IFRS 16 IFRS 16 Less Less IFRS 16 E Less than one year 12.7 9.9 P P O 31 December interest depreciation amortisation Less lease IAS 17 31 December O R 2022 charge charge of legal fees incentives lease cost 2022 R One to five year 40.3 39.1 T £m £m £m £m £m £m £m T More than five years 82.8 90.1 Revenue 1,381.5 – – – – – 1,381.5 135.8 139.2 G G Cost of sales (930.8) – – – – – (930.8) O O VE VE Gross profit 450.7 – – – – – 450.7 The maturity profile of discounted lease cash flows accounted for under IFRS 16 is: R R Selling and distribution expenses (113.0) – – – – – (113.0) 2023 2022 NAN Administrative and other NAN £m £m operating expenses (479.5) – 11.0 (0.1) 1.1 (14.5) (482.0) C C Less than one year 8.8 7.4 E E Operating loss (141.8) – 11.0 (0.1) 1.1 (14.5) (144.3) One to five years 28.5 26.8 Finance income 15.5 – – – – – 15.5 More than five years 60.0 65.6 F F Finance expense (368.7) 4.5 – – – – (364.2) I I 97.3 99.8 NAN NAN (Loss)/profit before tax (495.0) 4.5 11.0 (0.1) 1.1 (14.5) (493.0) Analysed as: C C IAL IAL Current 8.8 7.4 S S Adjusted EBITDA (note 34) 190.2 – – (0.1) 1.1 (14.5) 176.6 Non-current 88.5 92.4 T T A A 97.3 99.8 T T E 17 INVENTORIES E M 2023 2022 M E E A reconciliation of the lease liability from 1 January to 31 December for the current and prior year is disclosed within note 28. N £m £m N T T The total lease interest expense for the year ended 31 December 2023 was £4.1m (2022: £4.5m). Total cash outflow for leases accounted for under IFRS 16 SParts for resale, service parts and production stock 157.7 152.2 S for the current year was £7.9m (2022: £10.0m). Expenses charged to the Consolidated Income Statement for short-term leases for the year ended 31 Work in progress 33.2 48.5 December 2023 were £0.3m (2022: £0.7m). The portfolio of short-term leases at 31 December 2023 is representative of the expected annual short-term FFinished vehicles 81.8 85.5 F U U lease expense in future years. R 272.7 286.2 R T T H H E E The following disclosure has been included to facilitate the understanding of the impact of adopting IFRS 16 on the Group due to covenants in the Group’s R R finance arrangements that continue to use IAS 17. INFFinished vehicles include Group-owned service cars at a net realisable value of £49.0m (2022: £44.4m). INF The impact of IFRS 16 on the Consolidated Income Statement, excluding tax, for the year ended 31 December 2023 is: ORDuring the years ended 31 December 2023 and 2022, inventory repurchase arrangements were entered for certain parts for resale, service parts and OR M production stock. These inventories were sold and subsequently repurchased – see note 21 for further details. M Excluding A A Add back Add back impact of T18 TRADE AND OTHER RECEIVABLES T I I As reported IFRS 16 IFRS 16 Less Less IFRS 16 ON 2023 2022 ON 31 December interest depreciation amortisation Less lease IAS 17 31 December £m £m 2023 charge charge of legal fees incentives lease cost 2023 £m £m £m £m £m £m £m Amounts included in current assets Revenue 1,632.8 – – – – – 1,632.8 Trade receivables 216.2 137.0 Cost of sales (993.6) – – – – – (993.6) Indirect taxation 43.8 42.5 Gross profit 639.2 – – – – – 639.2 Prepayments 46.6 46.8 Selling and distribution expenses (143.8) – – – – – (143.8) Other receivables 15.6 19.4 Administrative and other 322.2 245.7 operating expenses (606.6) – 9.3 (0.1) 1.1 (11.7) (608.0) Operating loss (111.2) – 9.3 (0.1) 1.1 (11.7) (112.6) Amounts included in non-current assets Finance income 74.3 – – – – – 74.3 Other receivables 5.3 6.3 Finance expense (202.9) 4.1 – – – – (198.8) (Loss)/profit before tax (239.8) 4.1 9.3 (0.1) 1.1 (11.7) (237.1) Trade and other receivables for non-vehicle receivables are non-interest bearing and generally have terms of less than 60 days. Due to their short maturities, the fair value of trade and other receivables approximates to their book value. Certain vehicle trade receivables are financed through a wholesale Adjusted EBITDA (note 34) 305.9 – – (0.1) 1.1 (11.7) 295.2 finance facility (see below). Where vehicle trade receivables remain a part of the Group’s Consolidated Statement of Financial Position, these receivables bear interest after 60 days. Credit terms for such trade receivables vary between 0 and 180 days. Credit risk is discussed further in note 23. ASTON MARTIN LAGONDA ANNUAL REPORT AND ACCOUNTS 2023 171
 Annual Report and Accounts Page 172 Page 174