
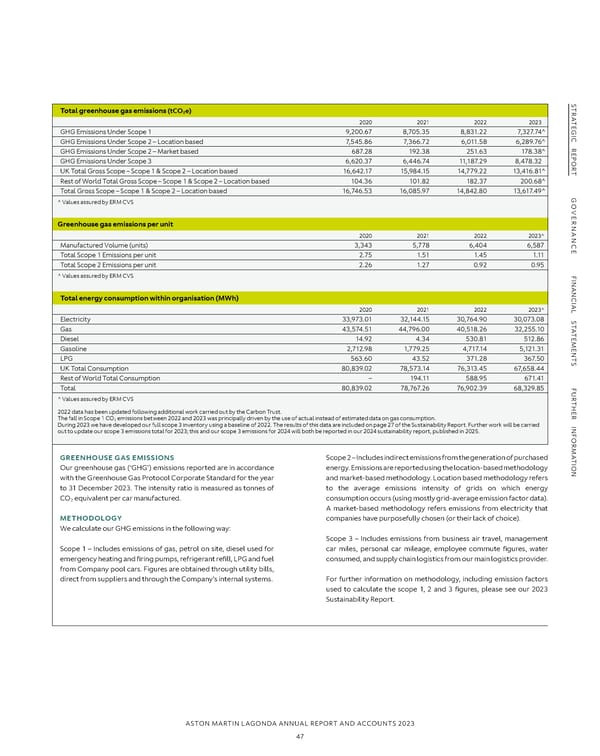
S S TR Total greenhouse gas emissions (tCO2e) TR A A TE 2020 2021 2022 2023 TE G GHG Emissions Under Scope 1 9,200.67 8,705.35 8,831.22 7,327.74^ G I I C C R GHG Emissions Under Scope 2 – Location based 7,545.86 7,366.72 6,011.58 6,289.76^ R E GHG Emissions Under Scope 2 – Market based 687.28 192.38 251.63 178.38^ E P P O GHG Emissions Under Scope 3 6,620.37 6,446.74 11,187.29 8,478.32 O R R T UK Total Gross Scope – Scope 1 & Scope 2 – Location based 16,642.17 15,984.15 14,779.22 13,416.81^ T Rest of World Total Gross Scope – Scope 1 & Scope 2 – Location based 104.36 101.82 182.37 200.68^ Total Gross Scope – Scope 1 & Scope 2 – Location based 16,746.53 16,085.97 14,842.80 13,617.49^ G G O ^ Values assured by ERM CVS O VE VE R R NAN Greenhouse gas emissions per unit NAN 2020 2021 2022 2023^ C Manufactured Volume (units) 3,343 5,778 6,404 6,587 C E Total Scope 1 Emissions per unit 2.75 1.51 1.45 1.11 E Total Scope 2 Emissions per unit 2.26 1.27 0.92 0.95 F ^ Values assured by ERM CVS F I I NAN NAN C Total energy consumption within organisation (MWh) C IAL 2020 2021 2022 2023^ IAL S Electricity 33,973.01 32,144.15 30,764.90 30,073.08 S T T A Gas 43,574.51 44,796.00 40,518.26 32,255.10 A T T E Diesel 14.92 4.34 530.81 512.86 E M M E Gasoline 2,712.98 1,779.25 4,717.14 5,121.31 E N N T LPG 563.60 43.52 371.28 367.50 T S UK Total Consumption 80,839.02 78,573.14 76,313.45 67,658.44 S Rest of World Total Consumption – 194.11 588.95 671.41 F Total 80,839.02 78,767.26 76,902.39 68,329.85 F U U R ^ Values assured by ERM CVS R T T H H E 2022 data has been updated following additional work carried out by the Carbon Trust. E R R INF The fall in Scope 1 CO emissions between 2022 and 2023 was principally driven by the use of actual instead of estimated data on gas consumption. INF 2 During 2023 we have developed our full scope 3 inventory using a baseline of 2022. The results of this data are included on page 27 of the Sustainability Report. Further work will be carried out to update our scope 3 emissions total for 2023; this and our scope 3 emissions for 2024 will both be reported in our 2024 sustainability report, published in 2025. OR OR M M A A T GREENHOUSE GAS EMISSIONS Scope 2 – Includes indirect emissions from the generation of purchased T I I ON Our greenhouse gas (‘GHG’) emissions reported are in accordance energy. Emissions are reported using the location-based methodology ON with the Greenhouse Gas Protocol Corporate Standard for the year and market-based methodology. Location based methodology refers to 31 December 2023. The intensity ratio is measured as tonnes of to the average emissions intensity of grids on which energy equivalent per car manufactured. CO2 consumption occurs (using mostly grid-average emission factor data). A market-based methodology refers emissions from electricity that METHODOLOGY companies have purposefully chosen (or their lack of choice). We calculate our GHG emissions in the following way: Scope 3 – Includes emissions from business air travel, management Scope 1 – Includes emissions of gas, petrol on site, diesel used for car miles, personal car mileage, employee commute figures, water emergency heating and firing pumps, refrigerant refill, LPG and fuel consumed, and supply chain logistics from our main logistics provider. from Company pool cars. Figures are obtained through utility bills, direct from suppliers and through the Company’s internal systems. For further information on methodology, including emission factors used to calculate the scope 1, 2 and 3 figures, please see our 2023 Sustainability Report. ASTON MARTIN LAGONDA ANNUAL REPORT AND ACCOUNTS 2023 47
 Annual Report and Accounts Page 48 Page 50